Chapter 1. Basic materials for 16S analysis#
You cannot teach a man anything; you can only help him find it within himself.
—To The Beginners
This chapter aims to lay down the foundations of your to microbiota analysis using QIIME2. By the end of the chapter, you will know:
How to install QIIME2 in your computer
The basic syntax and command line for using QIIME2
We will use the data from NEEN project (Johnson, et al, 2025) which is available through SRA database using accession number PRJNA1121063. Generally, the SRA Toolkit was recommanded to download multiple data from the database.
Downloading instruction can be find here:
But it is also ok to ask the data in person from me.
Note
The tutorial’s command will mostly focus on the short reads provided by illumina platform. We will focus on the command line version rather than the one used in Galaxy platform. But we still provide some basic instructions for these.
1.1 Basic Introduction to QIIME2#
QIIME2 has provided a quite user-friendly documents, check:
Note
The tutorial’s command will depends on version: qiime2-2023.2. The code might be changed slightly when you use different version of QIIME2
1.1.1 What is QIIME2?#
QIIME 2 is a powerful, extensible, and decentralized microbiome analysis package with a focus on data and analysis transparency. QIIME 2 enables researchers to start an analysis with raw DNA sequence data and finish with publication-quality figures and statistical results.
Key features:
Integrated and automatic tracking of data provenance
Semantic type system
Plugin system for extending microbiome analysis functionality
Support for multiple types of user interfaces (e.g. API, command line, graphical)
QIIME 2 is a complete redesign and rewrite of the QIIME 1 microbiome analysis pipeline.
1.1.2 QIIME2 artifacts and visualizations#
QIIME2 piepline contains two main types of files: input/output to QIIME 2 is in the form of QIIME 2 artifacts (.qza file extension) and QIIME 2 visualizations (.qzv file extension).
are objects that stores both data and metadata generated from a specific step in the pipeline.
You can observe what type of data is contained in an artifact with the command
qiime tools peek filename.qza.
contains the data to be visualized.
All QIIME 2 files (So both qza and qzv) can be viewed using a web browser with the
qiime tools viewcommand. Examples: view. Try to explore this interactive platform. The online browser is also available at https://view.qiime2.org.
The raw data in these files can be accessed using the command qiime tools export .
1.2 Prepare for the QIIME2#
This chapter will introduce some basic knowledge that you need to use QIIME2.
1.2.1 Prepare for the QIIME2: Installation#
The installation will vary depends on your computer systems. Check:
Or you can directly use Galaxy for graphical interface, which is a web-based platform for accessible, reproducible, and scalable biomedical data analyses (free).
If you choose to use command line, then I would suggest to use conda to install. This turtorial will mainly focus on the command line. But I think Galaxy also provide a good platform for bioinformatics study.
1.2.2 Prepare for the QIIME2: Sequencing data#
This step is very important as you will need to specify which type of data you have when you want to import your data into QIIME2, check Importing data:
Is your data clean? adpater, primer, barcode?
Which region is your data targeting?
Has your data been demultiplexed?
Is your data paired end or single end?
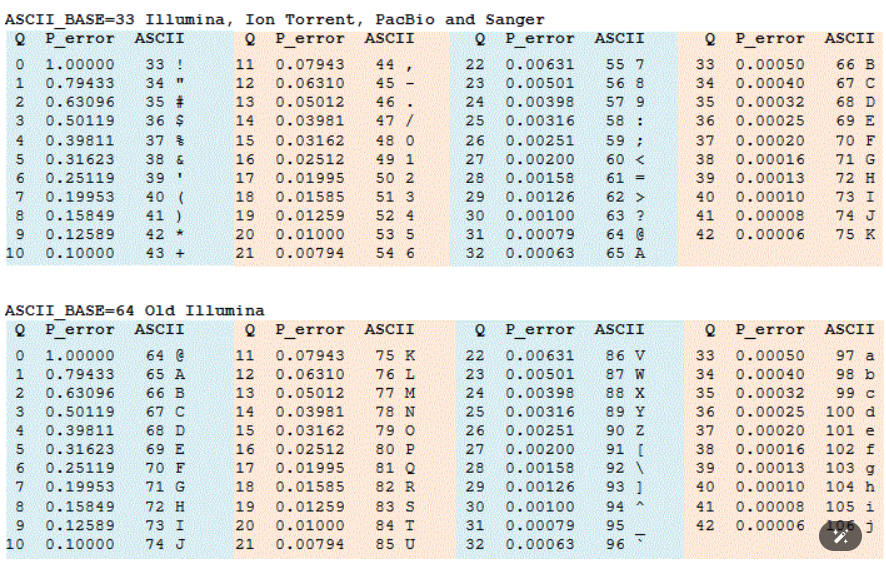
Phred33 or Phred64?
what sequencing platform did you use for sequencing?
what is adpater, primer, barcode?
Adapters: Facilitate attachment of DNA fragments to the sequencing platform.
Primers: Initiate the amplification of the target region (16S rRNA gene).
Barcodes: Distinguish between different samples in a multiplexed sequencing approach.
Fasta file from 16S is relatively small, therefore you can directly open the file by the text editors in your computer. Go and copy and paste several sequence from your file.
This is the information given by the company about the barcode and primer
SampleID |
BarcodeSequence |
LinkerPrimerSequence |
|---|---|---|
NEEN.011 |
CAACTA,TGACCA |
GTGCCAGCMGCCGCGGTAA,GGACTACHVGGGTWTCTAAT |
You might notice some letters other than A,T,G,C, like M, V. These are wild cards or IUPAC code, meaning it may refers to either A, T, G, C based on some rules. Check link
# 1 forward reads from NEEN.011 data

@A01426:40:H7H77DRXY:1:2101:28836:1047 1:N:0:TACGACGT+CCATGAAC
CAACTATGCCAGCAGCCGCGGTAATACGTAGGGGGCAAGCGTTATCCGGATTTACTGGGTGTAAAGGGAGCGTAGACGGCAGCGCAAGTCTGGAGTGAAATCCCATGGCTTAACCATGGAACTGCTTTGGAAACTGTGCAGCTGGAGTGCAGGAGAGGTAAGCGGAATTCCTAGTGTAGCGGTGAAATGCGTAGATATTAGGAGGAACACCAGTGGCGAAGGCGGCTTACTGGACTGTAACTGACGTTGA
+
FFFFFFFFFFFFFFFFFFFFFFFFFFFFFFFFFFFFFFFFFFFFFFFFFFFFFFFFFFFFFFFF:FFFFFFFFFFFFFFFFFFFFFFFFFFFFFFFFF::FFFFFFFFFFFF:FFFFFFFFFFFF:,FFFFFFFFFFFFFFFFFFFFFFFFFFFFFFFF:FFFFFFFFFFFFFFFFFFFFFFFFFFFFFFFFFFFFFF:FFFFFFF,FFFFFFFFFFFFFFFFFFFFFFFFFFFFFFFFFFFFFFFFFFF

# 1 reverse reads from NEEN.011 data

@A01426:40:H7H77DRXY:1:2101:28836:1047 2:N:0:TACGACGT+CCATGAAC
TGACCAGGACTACTCGGGTATCTAATCCTATTTGCTCCCCACGCTTTCGAGCCTCAACGTCAGTTACAGTCCAGTAAGCCGCCTTCGCCACTGGTGTTCCTCCTAATATCTACGCATTTCACCGCTACACTAGGAATTCCGCTTACCTCTCCTGCACTCCAGCTGCACAGTTTCCAAAGCAGTTCCATGGTTAAGCCATGGGATTTCACTCCAGACTTGCGCTGCCGTCTACGCTCCCTTTACACCCAGT
+
FFFFFFFFFFFFFFFFFFFFFFFFFFFFFFFFFFFFFFFFFFFFFFFFFFFFFFFFFFFFFFFFFFFFFFFFFFFFFFFFFFFFFFFFFFFFFFFFFFFFFFFFFFFFFFFFFFFFFFFFFFFFFFFFFFFFFFFFFFFFFFFFFFFFFFFFFFFFFFFFFFFFFFFFFFFFFFFFFFFFFFFFFFFFFFFFFFFFFFFFFFFFFFFFFFFFFFFFFF:FFFFFFFFFFFFFFFFFFFFFFFFFFFFFFF
Tip
Is your data clean? adpater, primer, barcode?
– Try to find the position of Barcode, Primer here in the example above. For the Primer sequence, generally it is ok to have one mismatch.
Which region is your data targeting?
– The region of your target can always match with the primer. Search “GTGCCAGCMGCCGCGGTAA GGACTACHVGGGTWTCTAAT v4”
Has your data been demultiplexed?
– If the data hasn’t been demultiplexed, it means you will have only one file for multiple sample.
Is your data paired end or single end?
– one file or two file for one single sample
Phred33 or Phred64?
– Phred64 is old-fashioned. So normally it would be Phred 33. Check the table below. Based on the table, it is clear that our file is Phred33, as we have seen “,”
what sequencing platform did you use for sequencing?
– This step is very important. As the main part of this tutorial will focus on illumina short-reads sequencing platform. If you use full-length Pacbio CCS. Then please check other tutorial or use chapter 2 “Other platform” for a start.
1.2.3 Prepare for the QIIME2: sample metadata#
Sample metadata will be used for diversity analysis, feature-table summarize or ANCOM analysis, etc, to provide other information like, Grouping information to the QIIME2. However, I suggest to use R for the downstream analysis. To do the analysis in R, we also need a similar table, therefore, you are highly suggest to finish a similar sample metadata for your own data in this step, no matter you choose QIIME2 or R.
Sample metadata is saved in a tab-separated text file (.tsv). Each row corresponds to a sample, while each column denotes a specific metadata category. The first line serves as a header, listing the names of the metadata categories.
This file was used for the software to do statistics based on your grouping
also provide some information regarding the sequencing, e.g. BarcodeSequence, LinkerPrimerSequence
The column name for the sample names is fixed, such as “sample-id”. So you can only pick the column name that QIIME2 provided.
Check the Link for an example.
More#
Check the official “Moving pictures tutorial”. Read From “Introduction” to “Obtaining and importing data”
Check Points (End of the week)
Whether you have your software installed or settled with Galaxy?
Whether you have a proper sample metadata?
Whether you have a proper understanding towards your sequencing data?
Try using the command based on the sample qza and qzv shared within the moving pictures tutorial?